This configuration explains how to build a time series that displays the number of instances created over time (e.g. per month), even when the execution timestamp cannot be directly used in filters.
It introduces a two-step approach that enables accurate aggregation while remaining fully configurable.
Overview
The objective of this configuration is to:
-
Track the number of instances created over time
-
Overcome limitations related to filtering on execution timestamps
-
Provide a reusable and scalable pattern for time-based metrics
-
Allow retrospective analysis (works on already existing data)
Core principle
Since the execution timestamp (ExecutionInstant_i) cannot be directly used in filters for aggregation, this approach separates the logic into two steps:
-
Identify whether each instance was created during a given time period
-
Aggregate these results across all instances
Configuration
1. Instance-level time series (Boolean indicator)
A first time series is created at the instance level (e.g. Use Case).
This time series:
-
Evaluates whether an instance was created during a given period
-
Returns:
-
1if the instance was created during the period -
0otherwise
-
-
Acts as a building block for aggregation
Example formula (monthly)
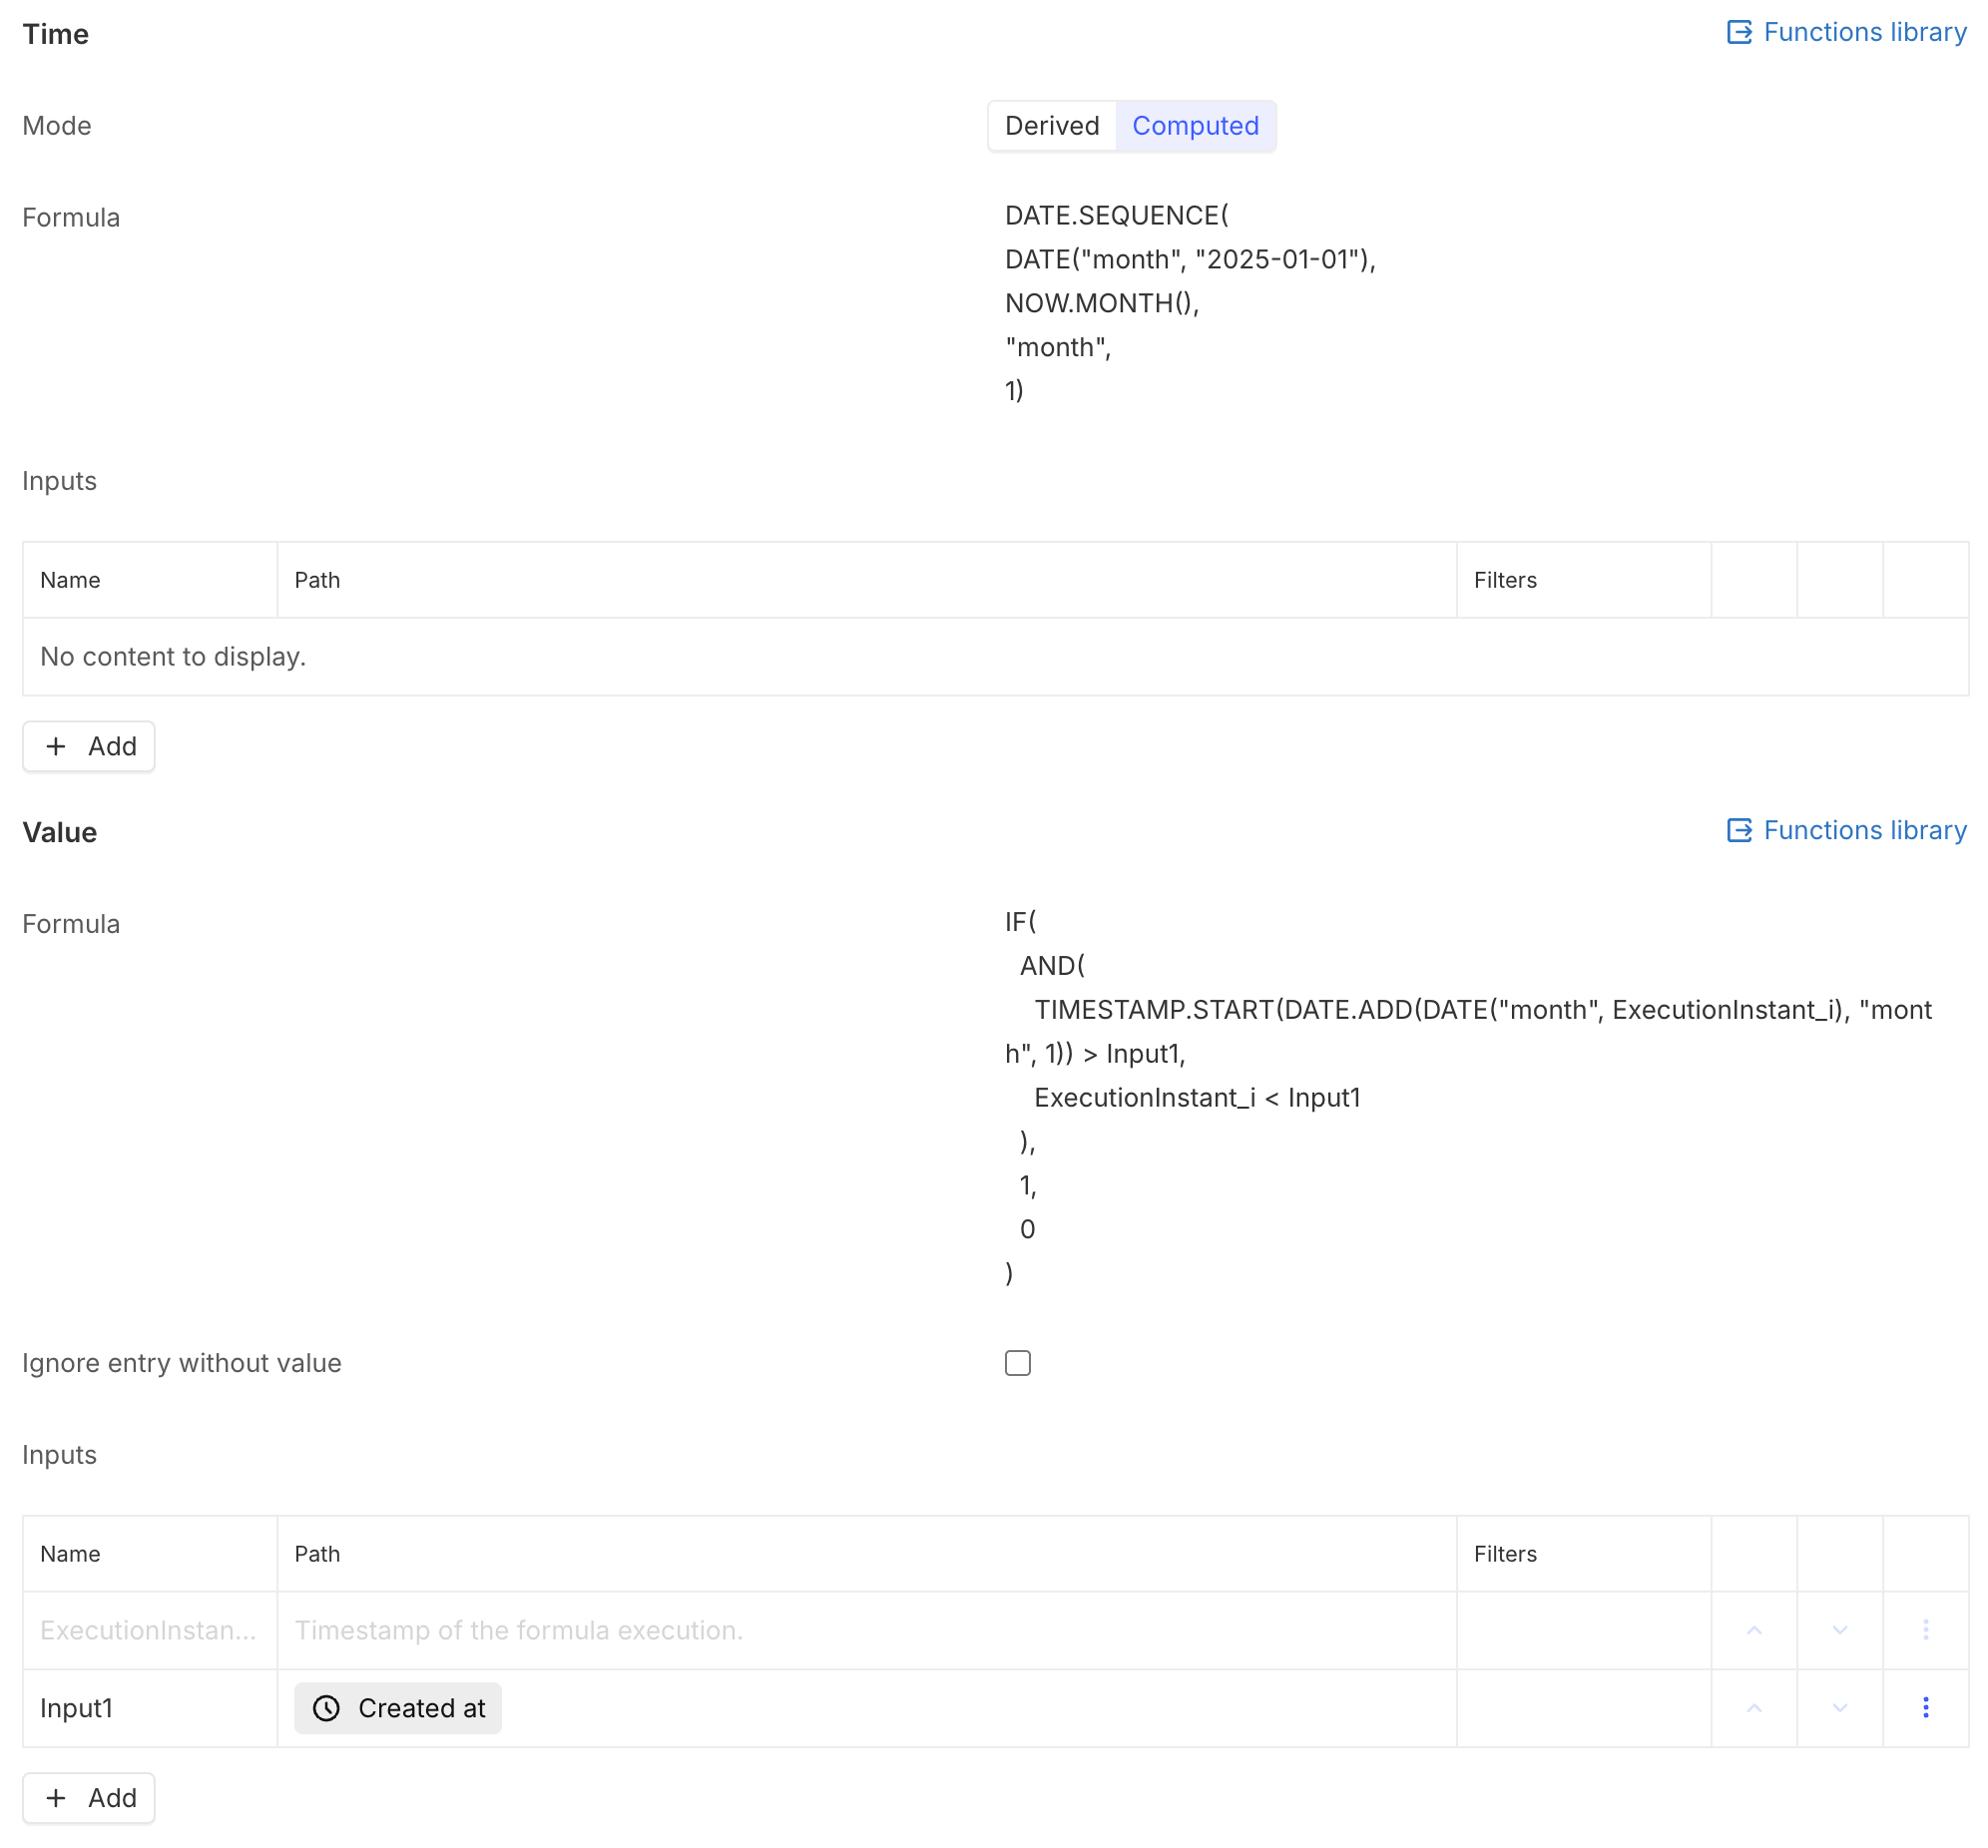
The formula checks whether the instance creation date falls within the evaluated month
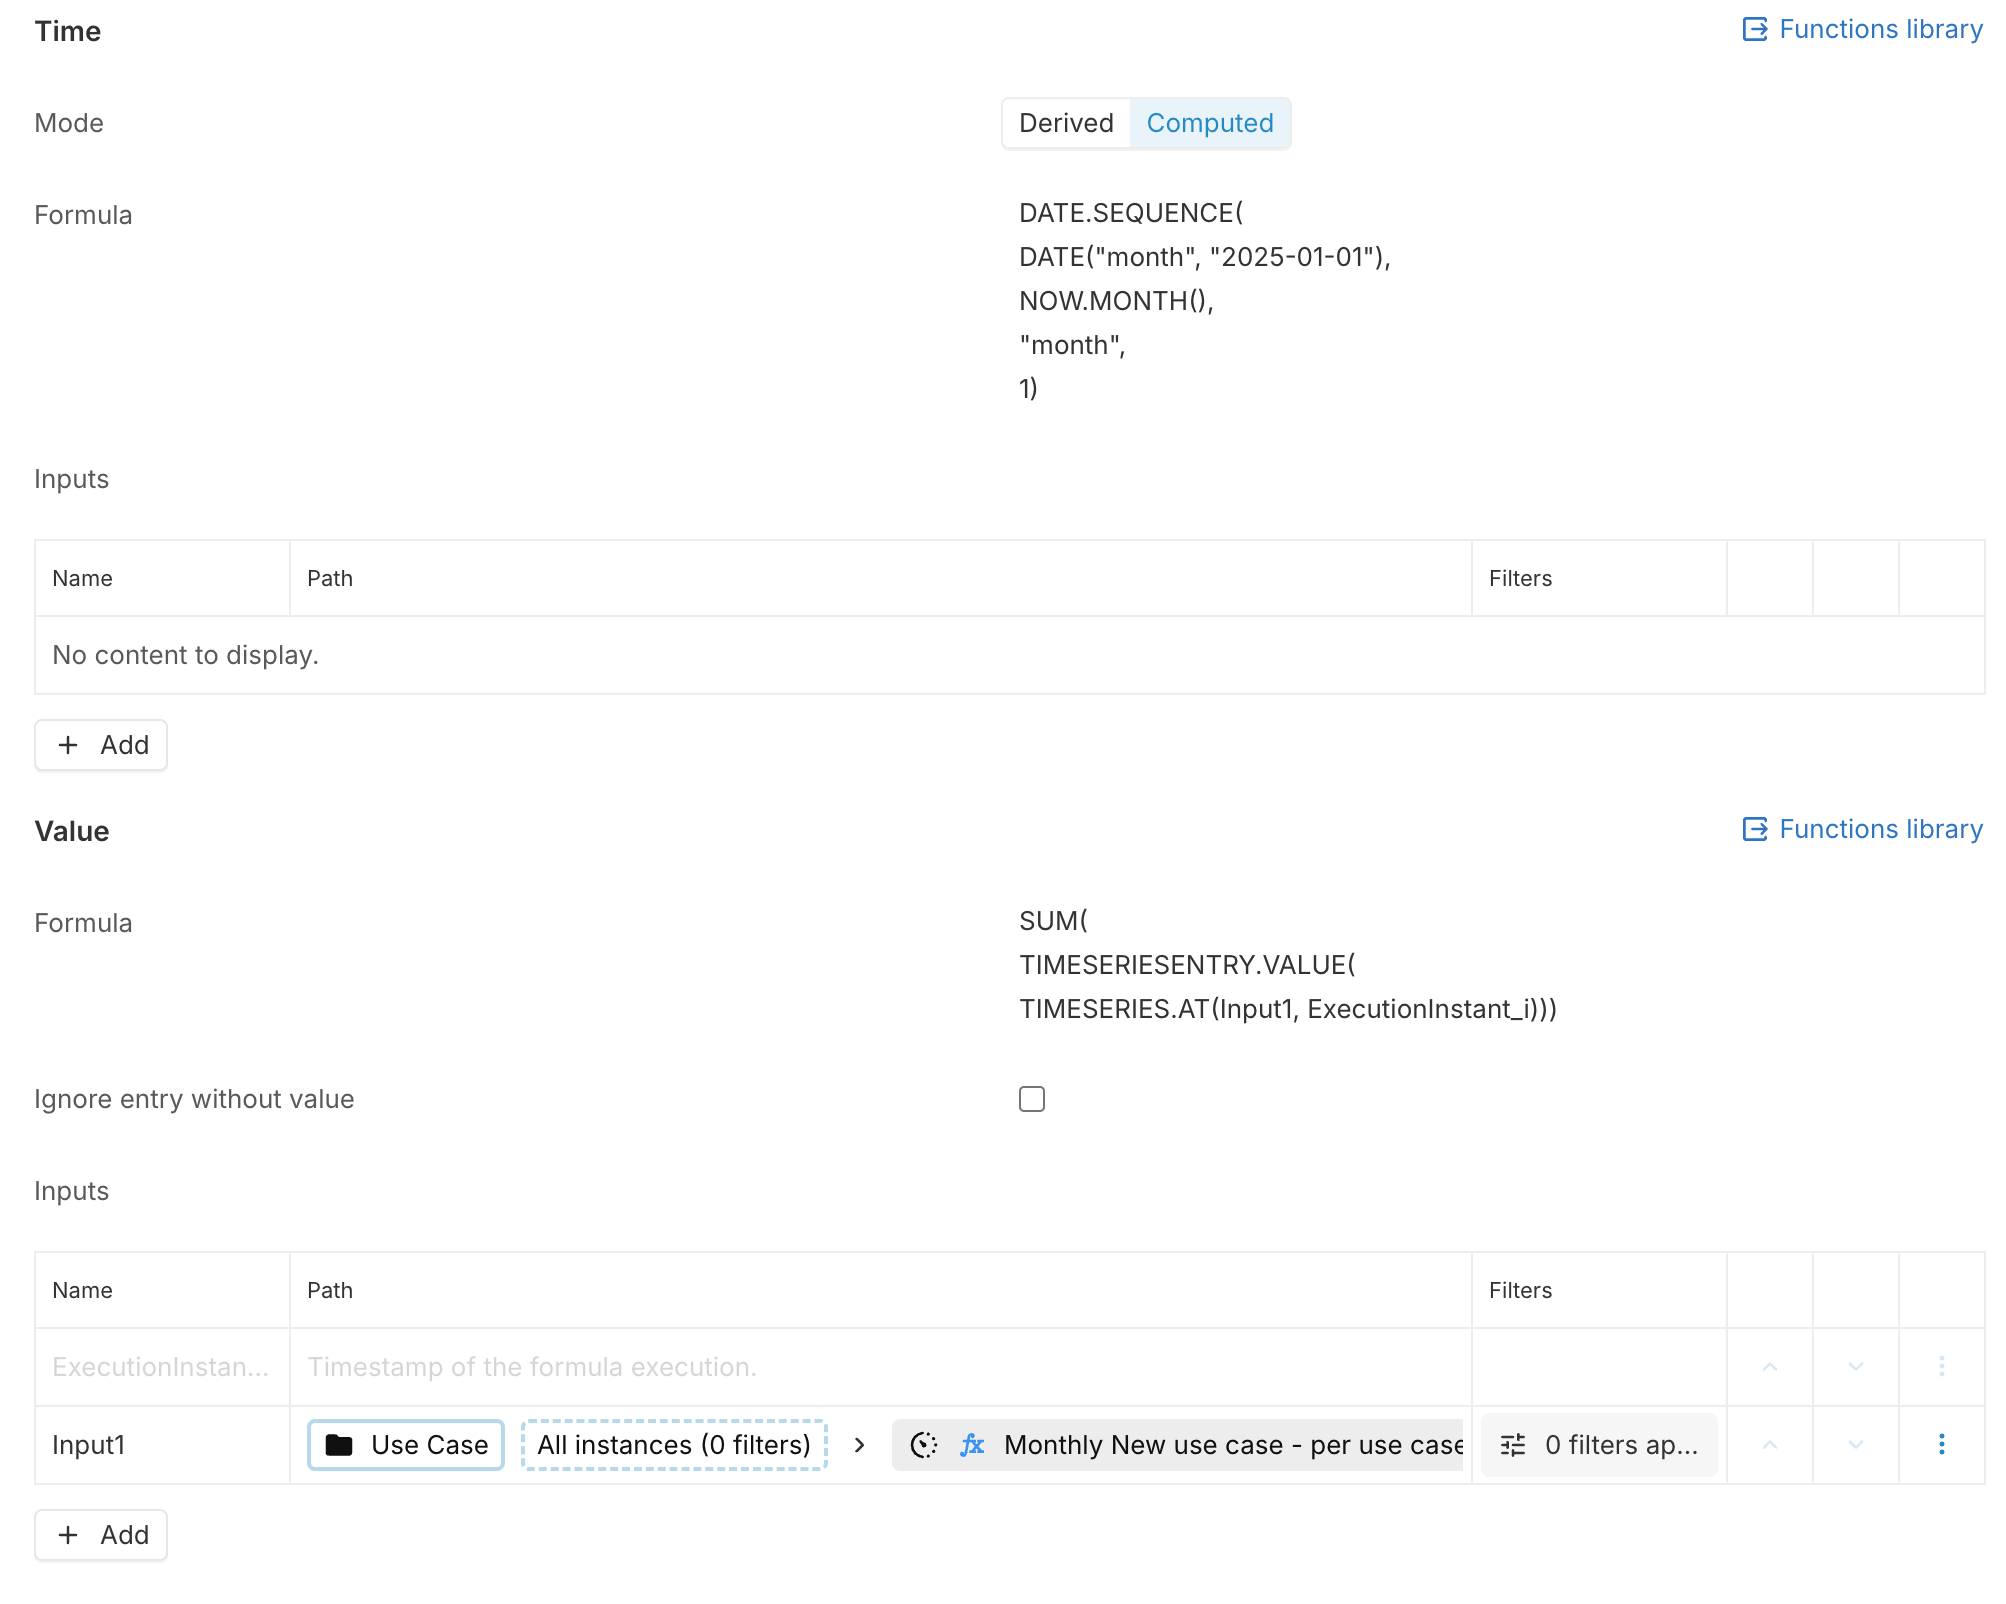
2. Aggregated time series (Global count)
A second time series is created to aggregate the results of the first one.
This time series:
-
Uses the population of instances (e.g. all Use Cases)
-
Applies the instance-level time series
-
Sums all values
Since each instance contributes either 0 or 1, the result is the total number of instances created during each period.
Example formula (monthly)
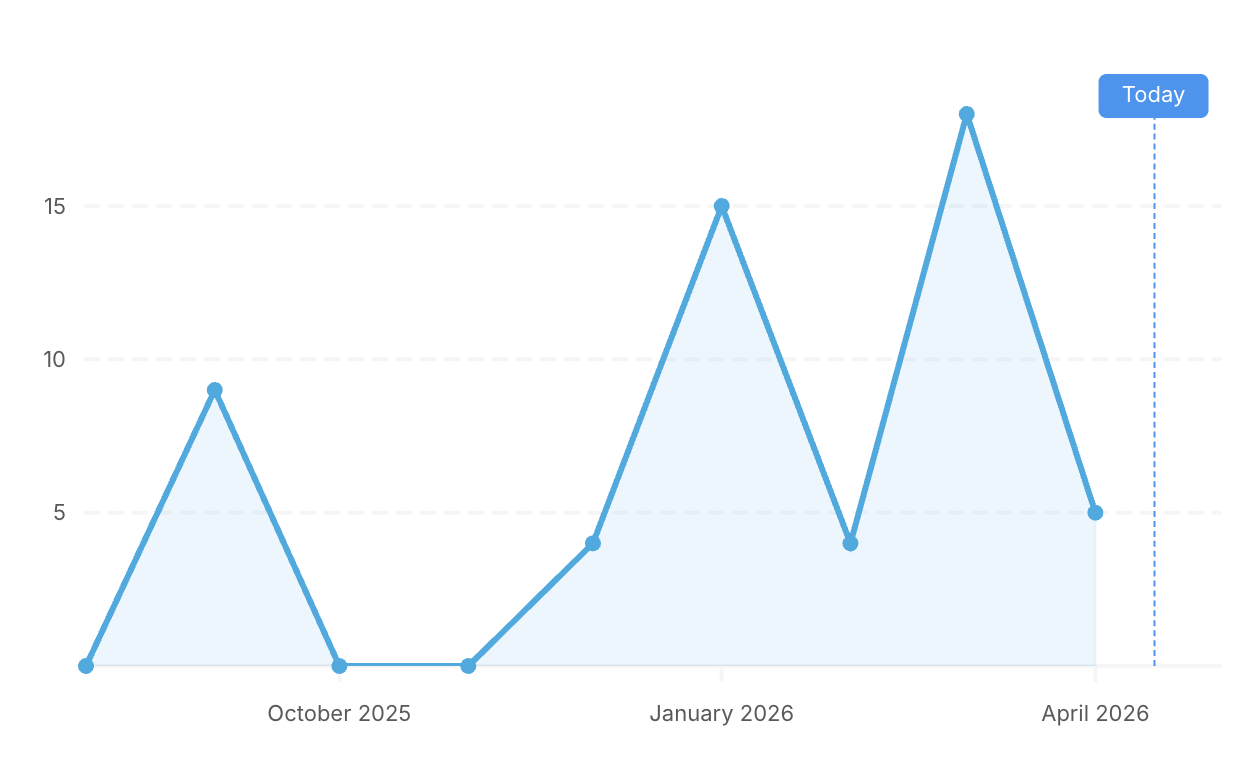
3. Visualization
The aggregated time series can be displayed in a chart.
Flexibility
Although the example uses a monthly granularity, the same approach can be adapted to:
-
Weekly
-
Quarterly
-
Yearly
-
…
Key benefits
-
Works despite filtering limitations on execution timestamps
-
Fully reusable pattern
-
Accurate aggregation across any population
-
Enables retrospective analysis (no need for prior setup)
-
Flexible time granularity
Summary
By combining:
-
A per-instance time series (0/1 indicator)
-
A global aggregation (sum)
This approach provides a simple and robust way to compute time-based metrics such as the number of instances created per period.